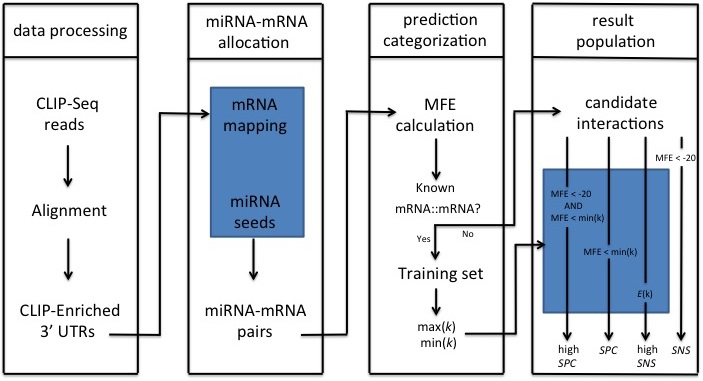
Figure below demonstrates the pipeline of miRTar2GO. In data processing step, genomic coordinates of the CLIP-Seq reads in different cell lines are mapped to the mRNAs to identify 3' UTRs which are enriched with AGO interaction sites. In miRNA-mRNA allocation step, the 6mer seed region of all known miRNAs are aligned to the reverse complementary sequence of AGO CLIPed sites in the 3' UTRs. The result of this step is a set of miRNA-mRNA candidates where the miRNA seed region of each candidate has a perfect binding site on its associated mRNA. In prediction categorization step, the whole miRNA sequence of each miRNA-mRNA is folded upon it's allocated CLIPed sequence to calculate the hybridization energy. At this step, interactions with a MFE greater than -15 are discard. The miRNA-mRNA interactions which are not known to be experimentally verified are selected to generate the unseen set. The miRNA-mRNA interactions which are known to be experimentally verified are used to calculated energy values for each miRNA including the minimum and the maximum of MFEs. In result population step, four different set of result sets are generated. Those interactions in the unseen set with a MFE less than -20 introduce the result of miRTar2GO sensitive. Interaction scores are calculated for all pairs of the unseen introducing the highly sensitive miRTar2GO result. Those interactions of the unseen set which have a hybridization energy of less than -20 and less than the maximum MFE value associated to the miRNA are introduced as miRTar2GO highly specific results. Those interactions of the unseen set which have a hybridization energy of less than the maximum energy associated to their corresponding miRNA are introduced as miRTar2GO specific results.
Please note that miRTar2GO does not introduce the experimentally validated interactions in its result set as that data is used to train the prediction model.
The target prediction setting of miRTar2GO highly sensitive aims to identify as many possible targets for a given microRNA as possible. However, the false positive ratio of this setting is high in nature. It is recommended to use the score option when showing the result as the predicted interactions with a higher score have a higher chance of functional interaction.
miRTar2GO sensitive introduces only those predicted miRNA::mRNA interactions which are already approved by RNAhybrid tool, that is, the hybridization energy between a given miRNA and it's predicted target should be less than -20.
This setting of miRTar2GO represents those miRNA::mRNA interactions which are more likely to be functional as it set a high cut-off on the hybridization energy value.
The computation setting of miRTar2GO highly specific has an even more restricted threshold compared to miRTar2GO specific. The result of this mode introduces less interaction, but a subset of interactions which have a really high chance of validity. miRTar2GO highly specific is recommended if one is looking for interactions with high certainty.
This value represents the conservation score of the interaction site of Ago2 and the 3' UTR. MicroRNAs tend to interact with conserved sites.
The interaction loci of microRNA's seed region and the CLIPed site is usually located in the middle of the CLIPed site. The less this value, the closer the seed match to the centre of the CLIPed site.
Represents the hybridization energy between the microRNA and a 40 nt strand of the binding site starting at microRNA seed match downstream the binding site.
For miRTar2GO highly sensitive, The relative distance of a predicted miRNA::target MFE to the MFEs of the given miRNA and its all experimentally verified targets is the main score. The higher this score, the stronger the probability of binding.
For miRTar2GO sensitive, specific and highly specific, the main scoring criterion is the minimum free energy of the hybridisation between microRNA's sequence and the CLIPed site.
Note that miRTar2GO represents prediction result for only those miRNAs (A total of 366 miRNAs) where there is at least one experimentally verified interaction present in the literature where the binding site has CLIP-Seq information.
MicroRNA expression data for each tissue is formed of multiple processed data set which are collected from different publicly available microRNA expression databases. For each tissue, multiple microRNA expression profiles (base) in different cell lines were collected, re-scaled, normalised and standardised to a scale of 1 to 100. Note that the value NA in the heatmap does not represent zero expression value, but the unavailability for the expression data for the corresponding microRNA. MicroRNA Expression Heatmap used in this study is available here.
The expression value of 0 in the result pages of miRTar2GO predictions should also be interpreted as "not available".
miRTar2GO uses the GOstats package which is a set of tools for interacting with GO and microarray data. More information about this package is available at Bioconductor's page here.
The pathway information used in miRTar2GO come from hiPathDB a human integrated pathway database with visualization. This database is a collection of the pathway information of BioCarta, Reactome, KEGG and Nci-Nature. HiPathDB data in the SQL format are available for download here.
MiRTar2GO also provides CLIP-Seq data processing for user provided data upon request. To identify possible miRNA targets in the CLIP-Seq data provided by user, the user must agree to give miRTar2GO the permission to use that data to improve the quality of service of miRTar2GO by possibly making the prediction sites available for public to use. The provided data needs to satisfy a few conditions before being accepted for analysis. The CLIP-Seq data should be representing a cell line which is not already included in the miRTar2GO. The user provided data should be already submitted to the Gene Expression Omnibus GEO.
The user provided CLIP-Seq data should be in BED6 format where the score column is representing the normalised read count (see the BED format section in the UCSC's frequently asked questions: data file formats).
If you're interested in having miRTar2GO analysing your CLIP-Seq data, send an email to Al on ALIREZA.AHADI@UTS.EDU.AU with information on your experiment, the data size, the CLIP-Seq protocol used to prepare the BED file, a link to the GEO page representing your data and your experiment in more details as well as the actual BED file in csv format.
Please cite our publication if you make use of our web-server/data: Ahadi, A., Sablok, G. and Hutvagner, G., 2016. miRTar2GO: a novel rule-based model learning method for cell line specific microRNA target prediction that integrates Ago2 CLIP-Seq and validated microRNA-target interaction data. Nucleic Acids Research, p.gkw1185.